This tool (version 1.0) displays monthly weather summaries for temperature, precipitation, radiation and other weather indicators (e.g. number of days with extreme rain events or warm nights) at the crop reporting district level for 12 US Midwest States. It contains data from 1984 to today and is updated every month. The user can select a crop reporting district, a weather variable of interest, the month or year of interest and the tool displays benchmarking graphs and options to download the data or the images. The tool is best suited to answer questions like how does the July 2020 precipitation compare with the previous years? In addition, we have included USDA-NASS historical corn and soybean yields to facilitate easy comparisons between weather deviations and yield deviations. In the future, we will expand the tool to include APSIM soil water/nitrogen simulated data as well options to display monthly maps. User feedback will be incorporated in version 2.0.
There were two motivations. First, the FACTS project expanded its forecast and assessment focus from 10 locations in Iowa to nearly 1,000 counties across the US Midwest. Thus, given the large amount of data, it was necessary to develop a webtool to easily check the weather inputs to crop and machine learning models. That way, the interpretation of model-based predictions becomes efficient and transparent. Second, weather is the main driver of yield and soil water/nitrogen fluctuations from year to year across the landscape and thus having a benchmarking system in place will assist decision making. While there are several weather tools available (e.g. Climate Engine, Daymet, NOAA), our tool provides additional weather indicators relevant for row crop performance in the US Corn Belt.
There are three innovations. First, the aggregation of the weather at the crop reporting district level. Instead of using data from 1 or 2 weather stations to infer to a crop reporting district, we aggregate multiple data (e.g. 100 grids within a crop reporting district) to provide a more representative estimate. In the future, version 2.0, we may increase the resolution to county level. Second, the inclusion of nine weather indicators, which provide a different view of the weather. For example, a precipitation sum of 4 inches within a month provide some information but knowing also that there were 3 extreme rain events (each with rain above 1 inch) provides a more complete picture of the prevailing weather. The weather indicators can be expanded or updated in the future. Third, the flexibility in performing benchmarking graphs, which can save everyone time.
The weather data is a synthetic gridded product from various sources, called "IEM Reanalysis" system, which was engineered by Daryl Herzmann, Iowa Environmental Mesonet. The resolution of the synthetic gridded weather product is 0.125 x 0.125 degree latitude and longitude (about 15 km2 resolution). The temperature data generally comes from the NWS COOP observers. The precipitation data come from RADAR based estimates provided by NOAA MRMS, Oregon State's PRISM dataset and NWS COOP reports. The radiation data come from NASA POWER.
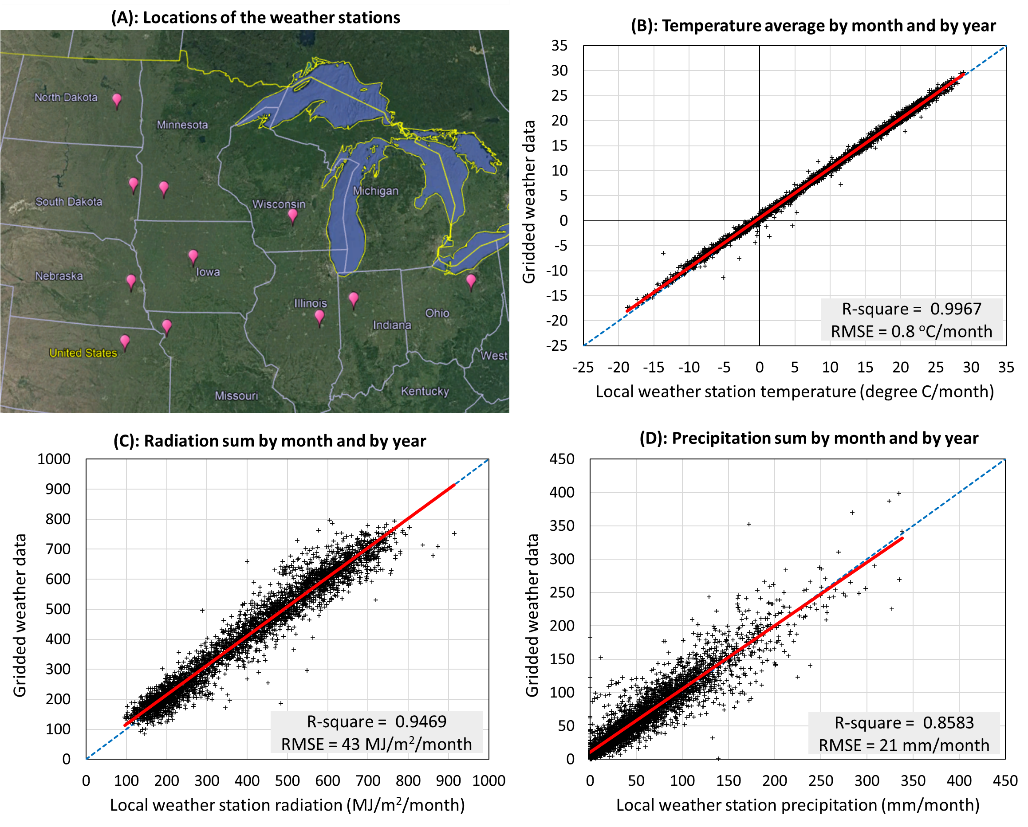
The accuracy of the monthly gridded weather data is sufficiently well as illustrated in the figure below. The gridded product captures 99% of the observed variability in temperature, 95% of the observed variability in radiation and 86% of the observed variability in precipitation in our single point tests across 11 locations in the US Corn Belt.
This tool is the product of a collaborative work between Archontoulis and Schnable Labs (Department of Agronomy) and funded by the Plant Sciences Institute, Iowa State University. Sotirios Archontoulis conceptualized the tool, performed weather data QC and determined the weather indicators. Cheng-Ting "Eddy" Yeh developed the web-interface. Pat Schnable provided feedback on the concept and development process. Daryl Herzmann, Iowa Environment Mesonet, compiled the gridded weather data. Isaiah Huber and Makis Danalatos aggregated the weather data to crop reporting district level. Mark Licht provided expert feedback on the web-tool.
For questions please email: Sotirios Archontoulis (sarchont@iastate.edu)